Latest original CFS maps from NOAA
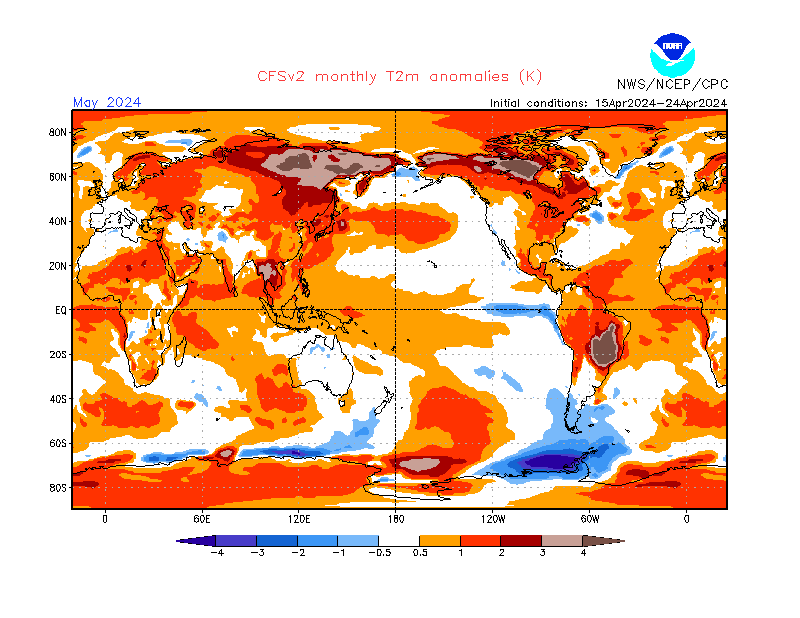
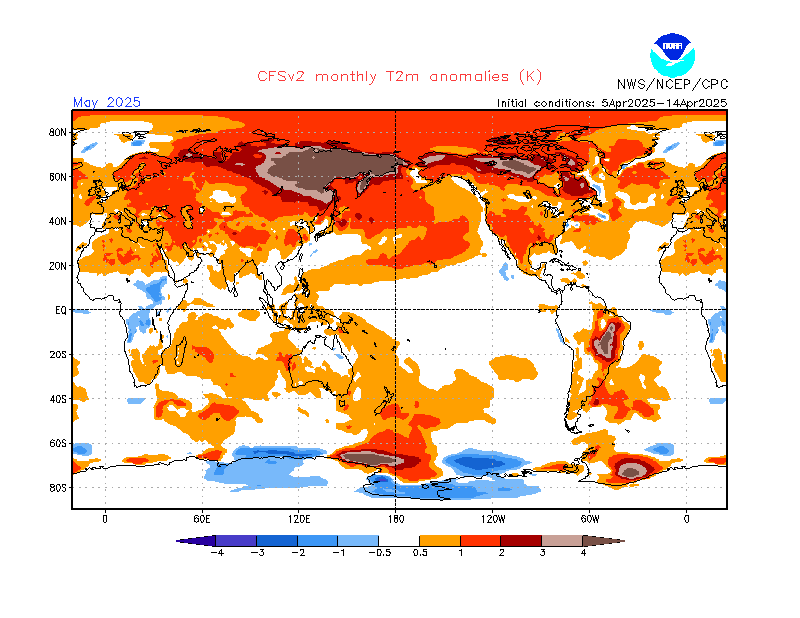
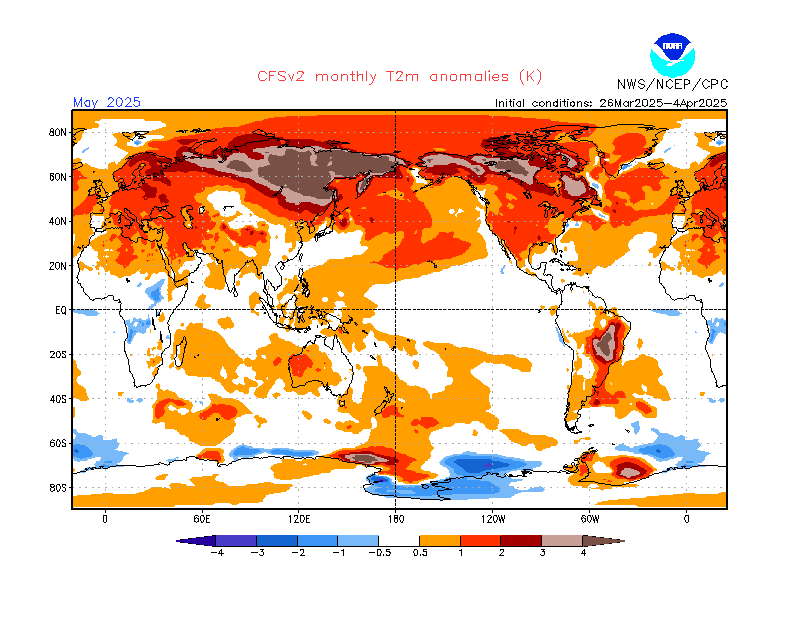
Temperature anomalies
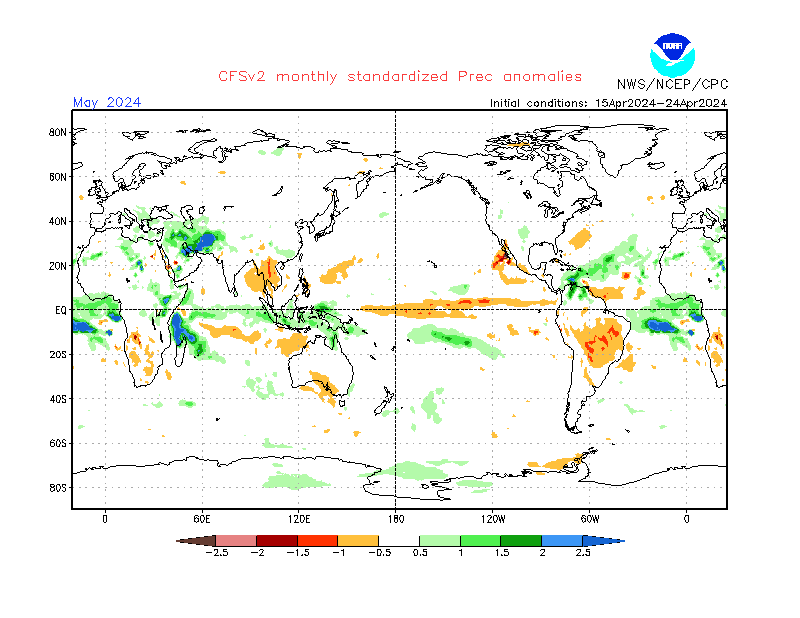
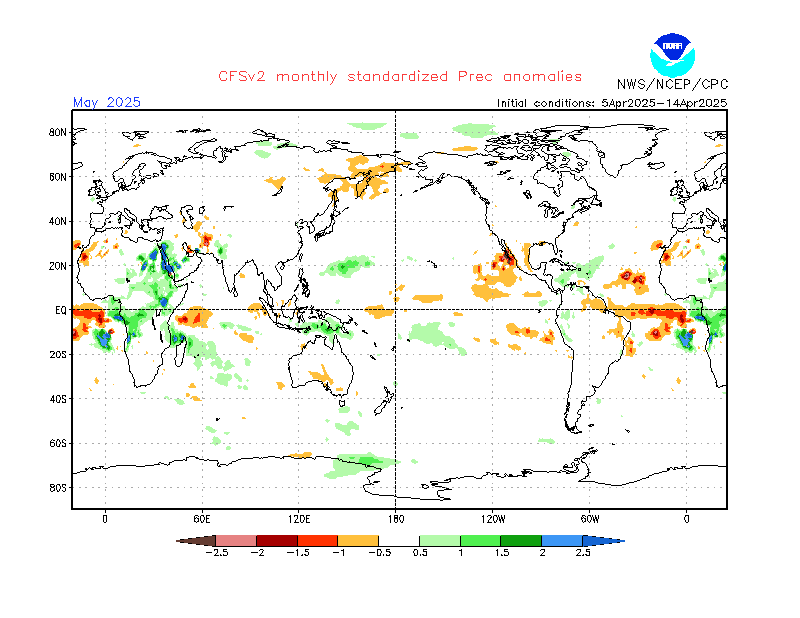
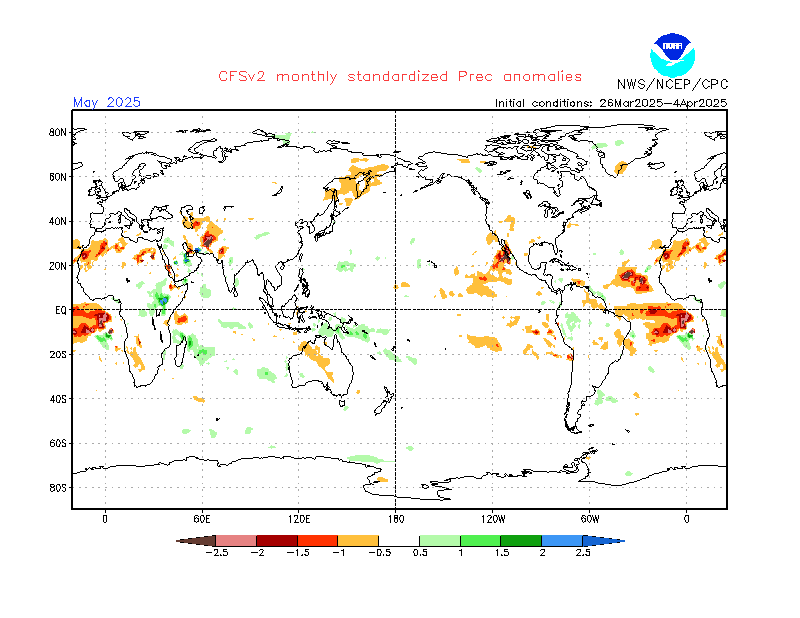
Precipitation anomalies
Sea surface temperature anomalies
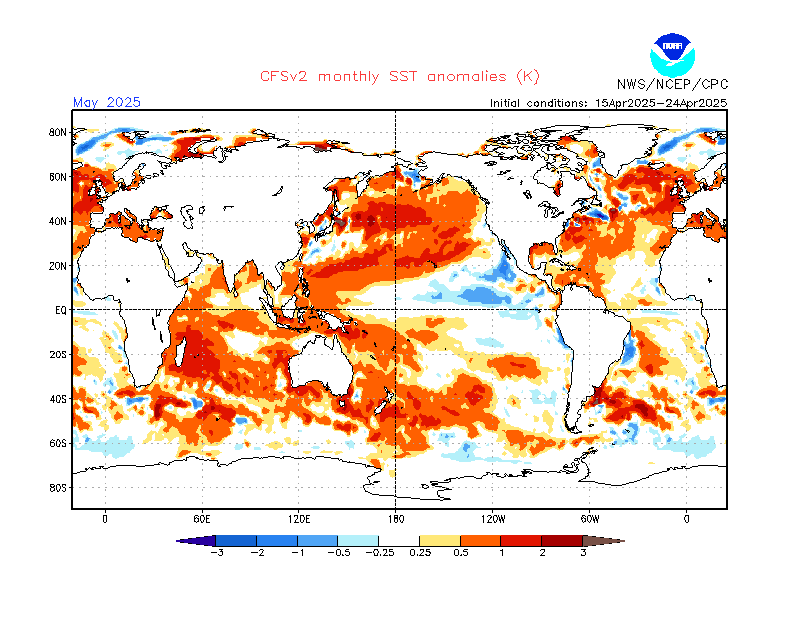
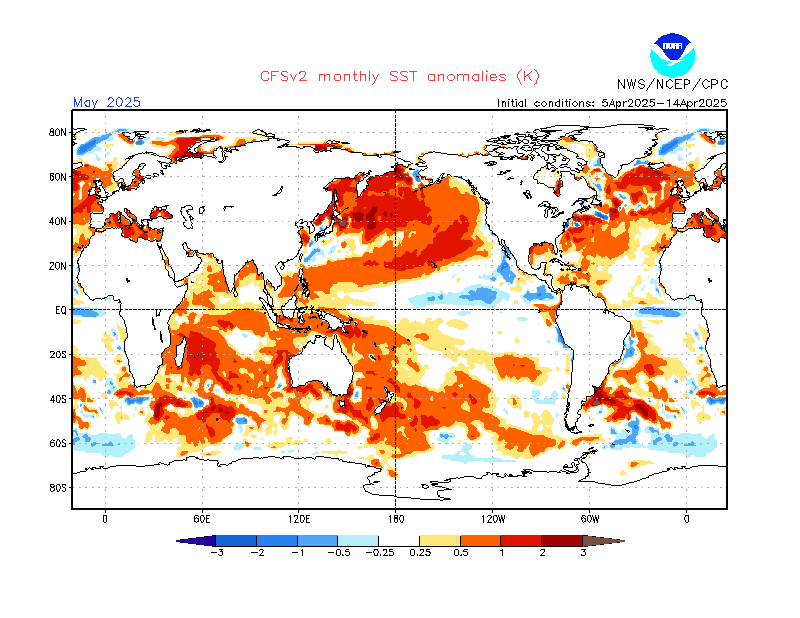
Forecasted anomalies calculated with respect to 1991-2020 period. Past weather dataset generated as hindicast by CFS model itself. Forecast ensembles used to create the maps consist of 40 members from initial a period of past 10 days.
Overlaying maps for previous ten-day periods shows whether the forecast is stable for certain areas. A mix of opposite colors on the superimposed maps indicates uncertainty in the forecast.
More charts are available on the official website NOAA Climate Prediction Center